Threat Dome Tool
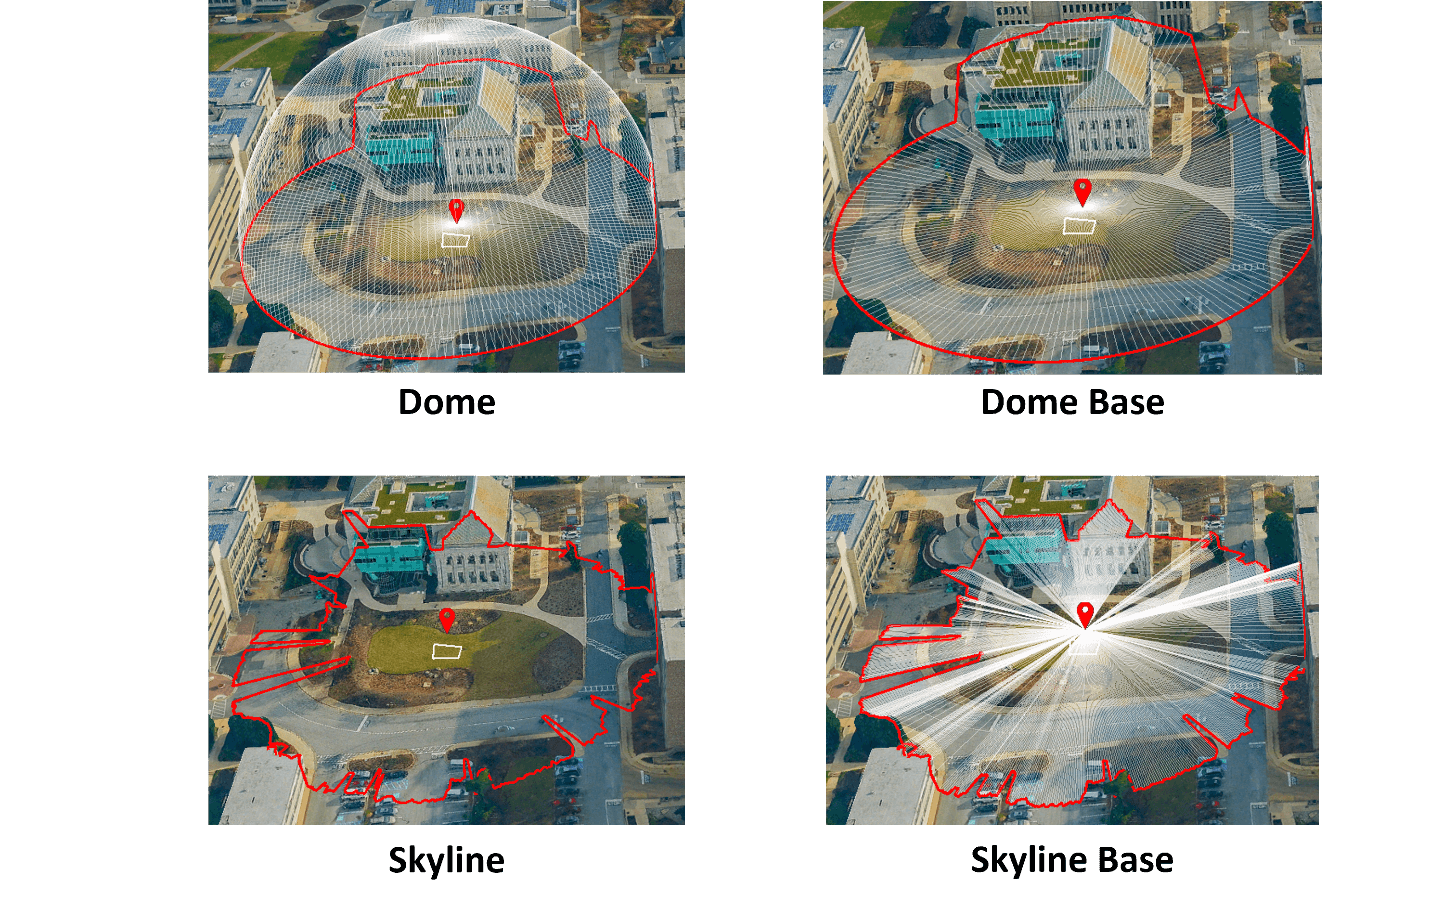
The threat dome tool analyzes and displays the area that is visible from a given point on the terrain within a 360° horizontal field of view. Several display options for the threat dome are available so that the particular information required can be easily visualized. The threat dome can be generated as a dome that defines the outer boundaries of the volume that is visible from the viewpoint, as a dome base that divides between visible and non-visible areas, or alternatively as a skyline that highlights obstructions to the field of view. After generating the threat dome, results can be further analyzed by creating a profile graph.
Using the Threat Dome Tool
To use the threat dome tool:
1. On the Analysis tab, in the Terrain Analysis group, click Threat Dome. The Threat Dome dialog is displayed.
Threat Dome
2. Set the Threat Dome properties:
|
Type |
Output of the tool. Select one of the options for representing the visible area from the threat point. The threat dome is made up of a center point representing the viewer, a ring that circumscribes the area that can be seen, and in some a dome and/or base. § Dome – A spherical dome is generated that encloses all points that can be viewed from the dome’s viewpoint. § Dome base – A circular surface is generated defining the area below which all points are not visible from the dome's viewpoint. § Skyline – An outline of the visible terrain and objects is generated, highlighting any objects (e.g., buildings or mountains) that block the viewpoint's field of view. § Skyline base – An outline of the visible terrain and objects is generated, with lines extending from the viewer to the ring. |
|
Quality |
Determines the distance between sample points by which the threat dome is being calculated. High Quality will yield a more accurate result, but take longer to calculate. |
|
Radius |
Radius of the threat dome. |
|
Viewer Altitude |
Altitude above the ground for the viewer location. |
|
Elevation Angle |
Enter the angle, from the ground, below which the viewpoint cannot see. For example, an elevation angle of zero creates a complete half sphere (or base of a half sphere if Type is set to Dome base), whereas an angle of 30 degrees creates an inverted cone, topped by a section of a sphere (or just an inverted cone if Type is set to Dome base). Note: This field is not available if Type is set to Skyline. |
3. Select one of the following methods of designating the area for which the threat dome should be calculated. If the input group contains multiple points, then individual threat domes are generated for each of the points
§ Set Position – Click in the desired location for the threat dome query. A marker ![]() is created at the drawn point.
is created at the drawn point.
§ Selected Group - Query points are created at all point elements (point features or point objects) in the selected group. Select the required group from the Project Tree, and then click Selected Group. A separate threat dome is created for each of the point elements, with the center of each threat dome indicated by a different color marker.
§ From Clipboard - Query points are created for all point elements in the clipboard. Copy the required elements to the clipboard, and click From Clipboard.
The created Threat Dome group appears in the Threat Dome group in the Project Tree. The created group includes a Dome polygon object, a Viewer image label representing the viewpoint, and a Ring polyline representing the perimeter of the volume that is visible from the viewpoint. You can open any of their property sheets to further control the way the threat dome object is displayed. See "Polygon Property Sheet Parameters", "Polyline Property Sheet Parameters", and "Image Label Property Sheet Parameters" in the "Objects and Labels" chapter for more information.
4. If you want to display a graph of the threat dome profile for the last created threat dome, click Show Profile. Note that if the input group contains multiple points, the color of each profile line on the Dome Ring Profile graph matches the color of the corresponding threat dome's query point marker in the 3D Window.
Note: The Show Profile button is only displayed after a threat dome is created.
A threat dome profile graph opens, displaying the terrain elevation profile.
Threat Dome Profile Graph
5. Use the Zoom in ![]() , Zoom out
, Zoom out ![]() , and Zoom to full extent of data
, and Zoom to full extent of data ![]() buttons to adjust the zoom as required.
buttons to adjust the zoom as required.
6. Determine what information is indicated on the graph by selecting any of the following display options:
|
Waypoint |
Select the check box to mark the waypoints on the graph with a |
|
Min/Max Elevation |
Select the check box to mark the maximum and minimum points with a |
|
Min/Max Slope |
Select the check box to mark the maximum and minimum slope with a |
7. If you want to export the threat dome profile to a shapefile layer, click Export to Layer.
Note: When a threat dome profile is exported to a layer, the line color on the graph corresponds to the color of the points that make up the line in the layer.
8. Point to any point on the graph to display the following values. If you want to display the values and also jump to the point on the terrain, then click instead of pointing.
|
X |
X-coordinate of the selected point. |
|
Y |
Y-coordinate of the selected point. |
|
Elevation |
Elevation value of the point above the terrain database vertical datum base ellipsoid. |
|
Slope |
Slope of the curve at the selected point |