Line of sight tools
The following line of sight tools are available:
Line of sight tool
The Line of Sight tool provides a visual indication of whether specific locations in the 3D World can be seen from a selected position. The tool displays a visual marker for the existence of a line of sight from a single observer position to multiple positions in the world.
This feature takes into account the observer’s viewpoint, direction of sight and distance of sight, to portray which locations can be viewed from the viewpoint, and which locations cannot be viewed. The observer and target positions can be set at any altitude above the terrain.
To use the Line of Sight analysis tool:
1. On the Analysis tab, in the Line of Sight group, click Line of Sight.
2. In the Line of Sight Analysis property sheet, enter the following parameters:
a. In the Analysis section, in the Sampling Interval field, enter the desired value for the sample resolution of your measurement. This value represents the distance between terrain samples for the measurement along each line. A smaller sample size is more accurate but slower to calculate.
b. In the Observer section, in the Height field, enter the desired value for the altitude of the observer.
Note: The X and Y observer position fields in the Observer section are derived from the point you select in the 3D Window (see below). They only become enabled after you place the Observer point, so you can modify the values as required in the property sheet.
c. In the Targets section, in the Height field, enter the desired value for the altitude of the target point or points.
3. Once you have set the necessary parameters, click the cursor to define your viewpoint for the observer.
4. Click in the 3D Window to place the target points. You must place at least one point in the 3D Window.
5. Right-click to finish the operation. At this point, TerraExplorer Pro begins to calculate the line of sight. This process can take a few seconds.
6. Once the line of sight analysis has been completed, you can edit the parameters and recalculate, or close the property sheet to finish the operation.
Once completed, a single line, or group of lines, marked on the terrain appear between the viewpoint and the endpoint. Target points that are visible from the observer viewpoint are colored green, whereas points that are not visible from the observer viewpoint are colored red.
Note: To perform another line of sight measurement, you must first close the property sheet either by clicking Close  on the property sheet, or by clicking again the line of sight command on the Analysis tab.
Line of sight property sheet parameters
|
Object Parameter |
Activity |
|
Observer All the fields in this section except Height are only enabled after the Observer viewpoint is selected in the 3D Window. |
|
|
X |
Enter the X-coordinate for the observer position. Change this value to move the observer position. |
|
Y |
Enter the Y-coordinate for the observer position. Change this value to move the observer position. |
|
MGRS |
The coordinates of the observer position in Military Grid Reference System (MGRS) coordinates. This field is only available if Show MGRS Coordinates was selected in the Options dialog. See "View" in the "Using TerraExplorer Options" chapter for more information. |
|
Height |
Enter the desired value for the observer altitude. |
|
Targets All the fields in this section except Height are only enabled after the Target points are selected in the 3D Window. |
|
|
Selected Point |
Select which target point’s position you want to edit. |
|
Target X |
The X-coordinate for the target position. |
|
Target Y |
The Y-coordinate for the target position. |
|
Target MGRS |
The coordinates of the target position in Military Grid Reference System (MGRS) coordinates. This field is only available if Show MGRS Coordinates was selected in the Options dialog. See "View" in the "Using TerraExplorer Options" chapter for more information. |
|
Target Height |
Enter the desired value for the altitude of the target point (or points). |
|
Analysis |
|
|
Sampling Interval |
Enter the desired value for the resolution of the measurement. This value represents the distance between sample points along each line. The smaller the sample interval, the more accurate the measurement, but the longer it takes to calculate. |
|
Recalculate |
Click this button to perform the calculation again with the updated parameters. |
|
Appearance |
|
|
Name |
Type the description or name of the Line of Sight. This text appears in the Project Tree as the name of the object. |
|
Activation Action |
Select the action to perform when the object is selected from the Project Tree. |
|
Timespan |
|
|
Start Time |
Click Edit and select the date and time when the Line of Sight should first become visible. |
|
End Time |
Click Edit and select the date and time when the Line of Sight should stop being visible. |
|
Visibility |
|
|
Default Viewing Distance |
Determines the viewing distance of the camera from the Line of Sight observer position. This distance is used as a stop mark for any "Fly-to" or "View Object" operation. It is also used when editing the object from the Project Tree. When this value is set to the default of -1, TerraExplorer calculates and sets the ideal viewing distance based on its size. |
|
Max. Visibility Distance |
Sets the maximal distance from the camera above which the Line of Sight disappears. |
|
Min. Visibility Distance |
Sets the minimal distance from the camera below which the Line of Sight disappears. |
|
General |
|
|
Show in Viewer |
Determines if the Line of Sight appears in the Project Tree when the file is viewed with TerraExplorer Viewer. |
|
Message |
The message associated with the object. The number displayed is the number of the message. To create a new message, or update an existing message, open the Create Message dialog by clicking in this field and selecting Edit. See "Using the Create Message Dialog" in the "Working with Objects" chapter for more information. |
|
Tooltip |
Type a tool tip to appear when the mouse cursor is placed over the Line of Sight in the 3D Window. |
Viewshed tools
The Viewshed tools enable you to calculate the view from a selected observer point or multiple observer viewpoints:
§ Calculate Viewshed – Calculates and marks all areas on the terrain and on 3D models and objects that are visible from a selected point on the terrain.
§ Calculate Multiple Viewsheds - Analyzes the visibility of a selected area from multiple viewshed observer viewpoints.
Note: To display a viewshed analysis from a series of points along a route, use the Viewshed on Route tools. See "Viewshed on Route" in this chapter for information.
The viewshed tool takes into account the viewpoint, direction of sight and distance of sight, when calculating which areas of the terrain are visible from the viewpoint, and which areas cannot be viewed. The viewpoint can be set at any altitude above the terrain.
Calculating a viewshed
The 3D viewshed calculates and marks all areas on the terrain and on 3D models and objects that are visible from a selected point on the terrain. Viewshed calculation is a two-step process: You first create a preview viewshed to quickly explore visibility and adjust viewshed parameters and then calculate a precise final viewshed.
To create a 3D viewshed:
1. On the Analysis tab, in the Line of Sight group, click the arrow under Viewshed, and select Viewshed Preview. The 3D Viewshed property sheet is displayed.
2. In the 3D Window, click to define your viewpoint for the 3D viewshed, and then click again to define your desired endpoint (defining the distance of sight).
3. In the 3D Viewshed property sheet, set the required parameters:
|
Object Parameter |
Activity |
|
Appearance |
|
|
Visible Area Color |
Select the fill color of the areas that are visible from the viewpoint. Click the Edit button to open the Color dialog, or type the color code in hexadecimal BBGGRR format (B = Blue channel 00-ff, G = Green channel 00-ff, R = Red channel 00-ff). |
|
Visible Area Opacity |
Enter the opacity for the visible area fill. The opacity is defined as a percentage, where 100% is opaque and 0% is transparent. |
|
Hidden Area Color |
Select the fill color of the areas that are not visible from the viewpoint. Click the Edit button to open the Color dialog, or type the color code in hexadecimal BBGGRR format (B = Blue channel 00-ff, G = Green channel 00-ff, R = Red channel 00-ff). |
|
Hidden Area Opacity |
Enter the opacity for the hidden area fill. The opacity is defined as a percentage, where 100% is opaque and 0% is transparent. |
|
Border Color |
Select the color of the lines that define the boundaries of the viewshed area. Click the Edit button to open the Color dialog, or type the color code in hexadecimal BBGGRR format (B = Blue channel 00-ff, G = Green channel 00-ff, R = Red channel 00-ff). |
|
Border Opacity |
Enter the opacity of the lines that define the boundaries of the viewshed area. The opacity is defined as a percentage, where 100% is opaque and 0% is transparent. |
|
Viewer Position |
|
|
Altitude Method |
Set the altitude method to be used for the viewer location: § Select Relative to Terrain to place the location point at a specified altitude above the ground. § Select Absolute to place the location point at a specified altitude above the terrain database vertical datum base ellipsoid. |
|
Altitude |
Enter the altitude above the ground for the viewer location. |
|
X |
Enter the X-coordinate of the viewer location. |
|
Y |
Enter the Y-coordinate of the viewer location. |
|
MGRS |
The coordinates of the viewer location in Military Grid Reference System (MGRS) coordinates. This field is only available if Show MGRS Coordinates was selected in the Options dialog. See "View" in the "Using TerraExplorer Options" chapter for more information. |
|
Direction |
Enter the horizontal angle of the camera when viewing the viewer location. |
|
Pitch |
Enter the tilt angle of the viewer position along its lateral axis relative to the horizon. |
|
Settings |
|
|
Spherical Viewshed |
Select Yes to create a full 360 degree sphere. |
|
Horizontal FOV |
Enter the horizontal angle limits, in degrees, of the viewshed. This field is unavailable when the Spherical Viewshed field is set to Yes. |
|
Vertical FOV |
Enter the vertical angle limits, in degrees, of the viewshed. This field is unavailable when the Spherical Viewshed field is set to Yes. |
|
Distance |
Enter the length of the viewshed analysis from the viewer in the distance units selected in the Options dialog. See "View" in the "Using TerraExplorer Options" chapter for information”. |
|
Quality |
Accuracy level of the viewshed calculation. |
|
General |
|
|
Tree Name |
Type the description or name of the viewshed. This text appears in the Project Tree as the name of the object. |
|
Message |
The message associated with the object. The number displayed is the number of the message. To create a new message, or update an existing message, open the Create Message dialog by clicking in this field and selecting Edit. See "Using the Create Message Dialog" in the "Working with Objects" chapter for more information. Note: The message is triggered when the user double-clicks the Project Tree entry that represents the viewshed or clicks the viewshed’s rays in the 3D Window (clicking the hidden/visible areas does not trigger the message). |
|
Visibility |
|
|
Max. Visibility Distance |
Sets the distance from the camera at which the viewshed disappears. |
|
Min. Visibility Distance |
Sets the minimal distance from the camera below which the viewshed disappears. |
|
Viewing Distance |
Determines the viewing distance of the camera from the viewshed. This distance is used as a stop mark for any "Fly-to" or "View Object" operation. It is also used when selecting to edit the object from the Project Tree. When this value is set to the default of -1, TerraExplorer calculates and sets the ideal viewing distance for the viewshed based on its size. |
|
Timespan |
|
|
Start Time |
Click Edit and select the date and time when the viewshed should start being visible. |
|
End Time |
Click Edit and select the date and time when the viewshed should stop being visible. |
4. Once completed, the viewshed appears on the terrain as a sector of a circle, where the center point is the viewpoint and the arc is the endpoint (marking the end of the distance of sight analysis), and the 3D Viewshed object appears in the Project Tree. Within the sector, areas that are visible from the viewpoint are colored green (default color), whereas areas that are not visible from the viewpoint are colored red (default color). The viewshed displayed is for preview only.
5. If you want to generate a precise viewshed, after adjusting the properties as required, select the viewshed preview in the Project Tree. Then on the Analysis tab, in the Line of Sight group, click the arrow under Viewshed, and select Calculate Viewshed. The Viewshed Query dialog box is displayed.
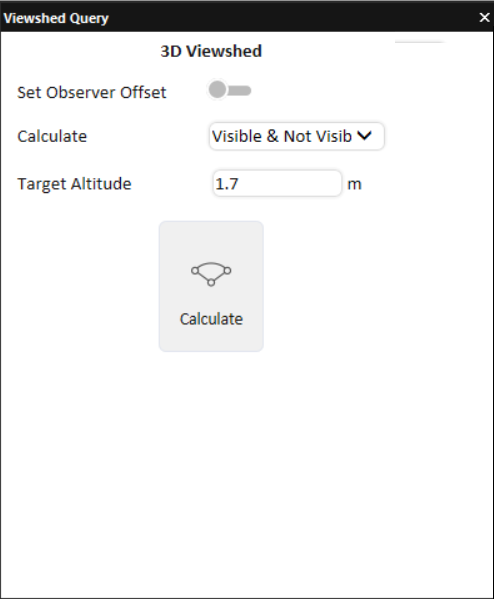
Calculate Viewshed
6. Set the following properties:
|
Property |
Description |
|
Set Observer Offset |
Enables or disables an observer height offset. |
|
Calculate |
Select what to calculate: visible, not visible, or both. |
|
Target Altitude |
Altitude of the target whose visibility is being queried. |
7. Click Calculate. Depending on the selected Calculate option, point clouds are overlaid on the terrain to represent visible, non-visible, or both result types. Click any point to display the line of sight and the distance between the observer location and the selected point, providing immediate visual insight into obstruction and visibility conditions.
Calculating multiple viewsheds
The Calculate Multiple Viewshed tool analyzes the visibility of a selected area is from multiple viewshed observer viewpoints. Based on the 3D viewshed analysis, this tool uses the previous results of the selected viewsheds to determine, for every point in the selected area, how many of the observers can see it. The spacing between observer viewpoints is calculated automatically based on the viewshed size.
The analysis result is displayed as point clouds overlaid on the terrain that graphically represent the visibility of the different points. Two color schemes are available; one scheme only distinguishes between visible (green) and invisible (red), while the other one color-codes the points according to their visibility percentage:
§ Green = More than 80% of the selected viewsheds’ observer viewpoints are visible from this point.
§ Yellow = 50-80% of the selected viewsheds’ observer viewpoints are visible from this point.
§ Orange = > 0% and < 50% of the selected viewsheds’ observer viewpoints are visible from this point.
§ Red = 0% of the selected viewsheds’ observer viewpoints are visible from this point.
In both color schemes, points outside the viewsheds' range are colored in black.
To calculate multiple viewsheds:
1. On the Analysis tab, in the Line of Sight group, click the arrow next to Viewshed, and then click Calculate Multiple Viewsheds. The Calculate Multiple Viewsheds dialog is displayed.
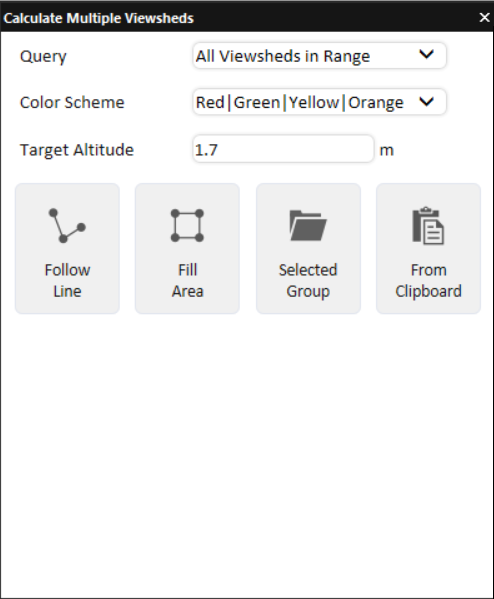
Calculate Multiple Viewsheds
2. Set the following properties:
|
Property |
Description |
|
Query |
Select either: § All Viewsheds in Range – Automatically includes all viewsheds that intersect with the query lines or polygons. § Select Viewsheds from List - The list displays all 3D viewsheds in the project. Select the required viewshed(s). Use CTRL-click or SHIFT-click to multi-select. |
|
Color Scheme |
Select the colors that will represent the visible and non-visible areas from the viewshed. Select either red | green or red | orange | yellow | green. |
|
Target Altitude |
Altitude of the target whose visibility is being queried. |
3. Select one of the following methods of designating the area to be analyzed
§ Follow Line – Query points are created along the drawn line. In the 3D Window, left-click to place the line waypoints, and right-click to complete the line.
§ Fill Area – Query points are created inside the drawn polygon. In the 3D Window, left-click to place the polygon waypoints, and right-click to complete the polygon.
§ Selected Group – Query points are created along all polygons or inside all polygons, in the selected feature layer. Select the required layer from the Project Tree, and then click Selected Group.
§ From Clipboard - Query points are created at all clipboard objects.
4. When the analysis is completed, the resulting visibility point clouds are displayed according to the selected color scheme. The percentage of visible points in range is reported in the tool’s panel.
Viewshed on route tool
The Viewshed on Route tools provide you with a graphical representation of the view on the terrain from a series of points (route):
§ 3D Viewshed on Route by Speed – Provides an animated representation of the terrain and objects that are visible as a dynamic object progresses along a defined route according to a set speed.
§ 3D Viewshed on Route by Time – Provides an animated representation of the terrain and objects that are visible as a dynamic object progresses along a defined route over a defined time frame.
§ 3D Viewshed on Route Query– Analyzes the visibility of a selected area from multiple viewshed observer viewpoints along a route.
Note: When calculating the viewshed from a route, the field of view is automatically set to 360°.
Creating a 3D viewshed on route – by speed
The 3D viewshed on route – by speed provides an animated representation of the terrain and objects that are visible as a dynamic object progresses along a defined route according to a set speed.
To create a viewshed from a route – by speed:
1. On the Analysis tab, in the Line of Sight group, click the arrow next to Viewshed on Route, and then click 3D Viewshed on Route – By Speed.
The 3D Viewshed on Route property sheet is displayed.
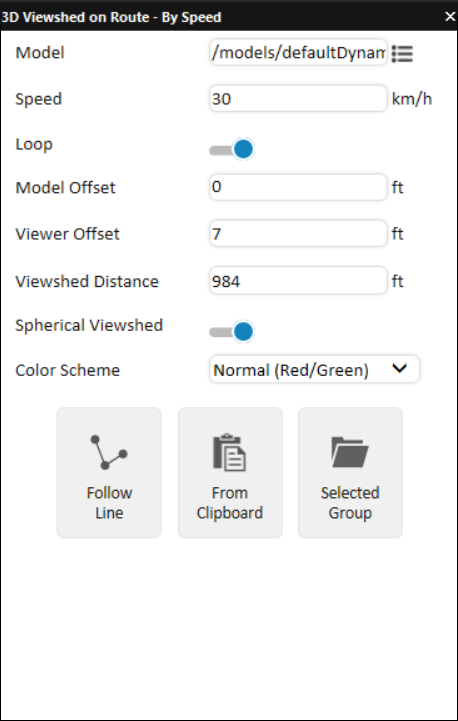
Viewshed on Route – By Speed Dialog
2. In the Viewshed on Route dialog, set the required parameters:
|
Property |
Description |
|
Model |
Graphic representation of the dynamic object. Click Select |
|
Speed |
Speed of the dynamic object. |
|
Loop |
Defines whether the dynamic object stops at the end of the path or loops back to the beginning. |
|
Model Offset |
Altitude of the dynamic object above the route. |
|
Viewer Offset |
Altitude of your viewpoints. |
|
Viewshed Distance |
Distance of the 3D viewshed. |
|
Spherical Viewshed |
Switch On to create a full 360 degree sphere. |
|
Color Scheme |
Select which visibility results are colored on the terrain and objects: § Normal (Red/Green) – Colors both visible (green) and non-visible (red) areas. § Visible (Green) – Colors only visible areas. § Not Visible (Red) – Colors only non-visible areas. § Random – Colors both visible and non-visible areas using randomly assigned colors. |
 to open the 3D Viewshed on Route dialog and choose from available 3D models in the Data Library. To use a model file from your computer, click
 3. Select one of the following methods of designating the waypoints to be created:
|
Method |
Description |
|
Follow Line |
Create waypoints along a line. Click Follow Line. Then in the 3D Window, left-click to place the line waypoints, and right-click to complete the line |
|
From Clipboard |
Create waypoints along all polyline objects on the clipboard. Click From Clipboard. |
|
Selected Group |
Create waypoints along all polylines in a selected group or layer. Select the required group or layer from the Project Tree and then click Selected Group. Only first level polylines in an existing group are included. |
4. A 3D Viewshed on Route – by Speed group containing the dynamic object and the viewshed are added to the Project Tree. As the dynamic object moves along the defined route according to the set speed, the viewshed dynamically changes providing an animated representation of the terrain and objects that are visible from each point on the route.
Creating a 3D viewshed on route – by time
The 3D viewshed on route – by time calculates and dynamically marks the terrain and objects that are visible from an object as it moves along a defined route over the course of a set time frame.
To create a viewshed from a route – by time:
1. On the Analysis tab, in the Line of Sight group, click the arrow next to Viewshed on Route, and then click 3D Viewshed on Route – By Time. The 3D Viewshed on Route property sheet is displayed.
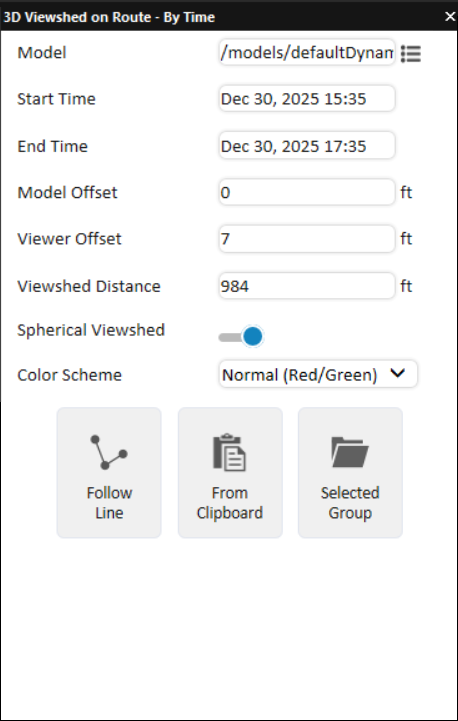
Viewshed on Route – By Time Dialog
2. In the Viewshed on Route dialog, set the required parameters:
|
Property |
Description |
|
Model |
Graphic representation of the dynamic object. Click Select |
|
Start Time |
The time the dynamic object begins moving along the defined route. The date and time slider automatically adjusts to correspond to the timespan defined by the Start Time and End Time. |
|
End Time |
The time the dynamic object reaches the end of the defined route. |
|
Model Offset |
Altitude of the dynamic object above the route. |
|
Viewer Offset |
Altitude of your viewpoints. |
|
Viewshed Distance |
Distance of the 3D viewshed. |
|
Spherical Viewshed |
Select Yes to create a full 360 degree sphere. |
|
Color Scheme |
Select which visibility results are colored on the terrain and objects: § Normal (Red/Green) – Colors both visible (green) and non-visible (red) areas. § Visible (Green) – Colors only visible areas. § Not Visible (Red) – Colors only non-visible areas. § Random – Colors both visible and non-visible areas using randomly assigned colors. |
3. Select one of the following methods of designating the waypoints to be created:
|
Method |
Description |
|
Follow Line |
Create waypoints along a line. Click Follow Line. Then in the 3D Window, left-click to place the line waypoints, and right-click to complete the line |
|
From Clipboard |
Create waypoints along all polyline objects on the clipboard. Click From Clipboard. |
|
Selected Group |
Create waypoints along all polylines in a selected group or layer. Select the required group or layer from the Project Tree and then click Selected Group. Only first level polylines in an existing group are included. |
4. A 3D Viewshed on Route – by Time group containing the dynamic object and the viewshed are added to the Project Tree. When the time and date are adjusted in the Time and Date slider and the dynamic object moves along the defined route, the viewshed dynamically changes, providing a representation of the terrain and objects that are visible from each point on the route.
Querying a 3D viewshed on route
The Viewshed Query tool analyzes the visibility from multiple observer viewpoints along a route to a selected target area. For each point in the target area, the tool determines whether it can be seen from at least one observer point along the route.
Results are exported as point clouds that graphically represent the visibility of the different locations: green points indicate locations visible from one or more observer points, while red points indicate locations that are not visible from any observer point. The spacing between observer viewpoints is calculated automatically based on the viewshed size and displayed in the tool's panel when the calculation is complete.
To perform a 3D viewshed on route – query:
1. On the Analysis tab, in the Line of Sight group, click the arrow next to Viewshed on Route, and then click 3D Viewshed on Route – Query. The 3D Viewshed on Route property sheet is displayed.
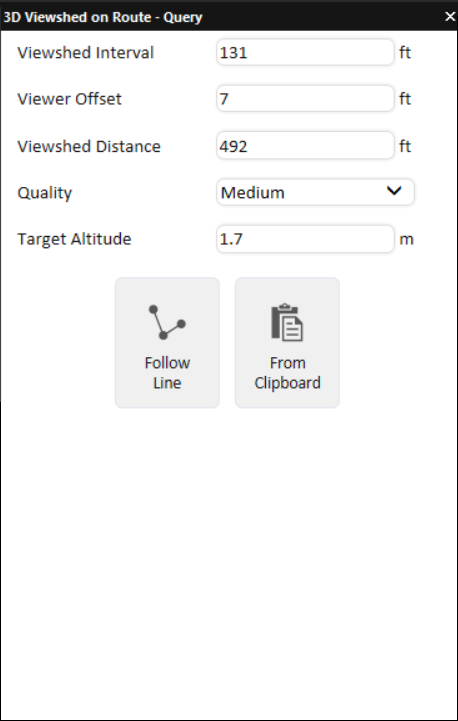
Viewshed on Route – Query Dialog
2. Set the required parameters:
|
Property |
Description |
|
Viewshed Interval |
The distance between terrain samples for the measurement along each ray. A smaller sample size is more accurate but slower to calculate. |
|
Viewer Offset |
Altitude of your viewpoints. |
|
Viewshed Distance |
Distance of the 3D viewshed. |
|
Quality |
Accuracy level of the viewshed calculation. |
|
Target Altitude |
Altitude of the target whose visibility is being queried. |
3. Select one of the following methods of designating the route waypoints:
|
Method |
Description |
|
Follow Line |
Create waypoints along a line. Click Follow Line. Then in the 3D Window, left-click to place the line waypoints, and right-click to complete the line. |
|
From Clipboard |
Create waypoints along a clipboard object. Note: Waypoints are only created for polyline clipboard objects. Click From Clipboard. |
4. The viewshed query generates two point clouds: one with green points representing locations visible from one or more observer points, and one with red points representing locations that are not visible from any observer point. When analysis is complete, the percentage of visible points is reported in the tool’s panel. Click any of the route’s Indicator  icons to toggle display of the viewshed calculated from that specific query point.
Visibility dome tool
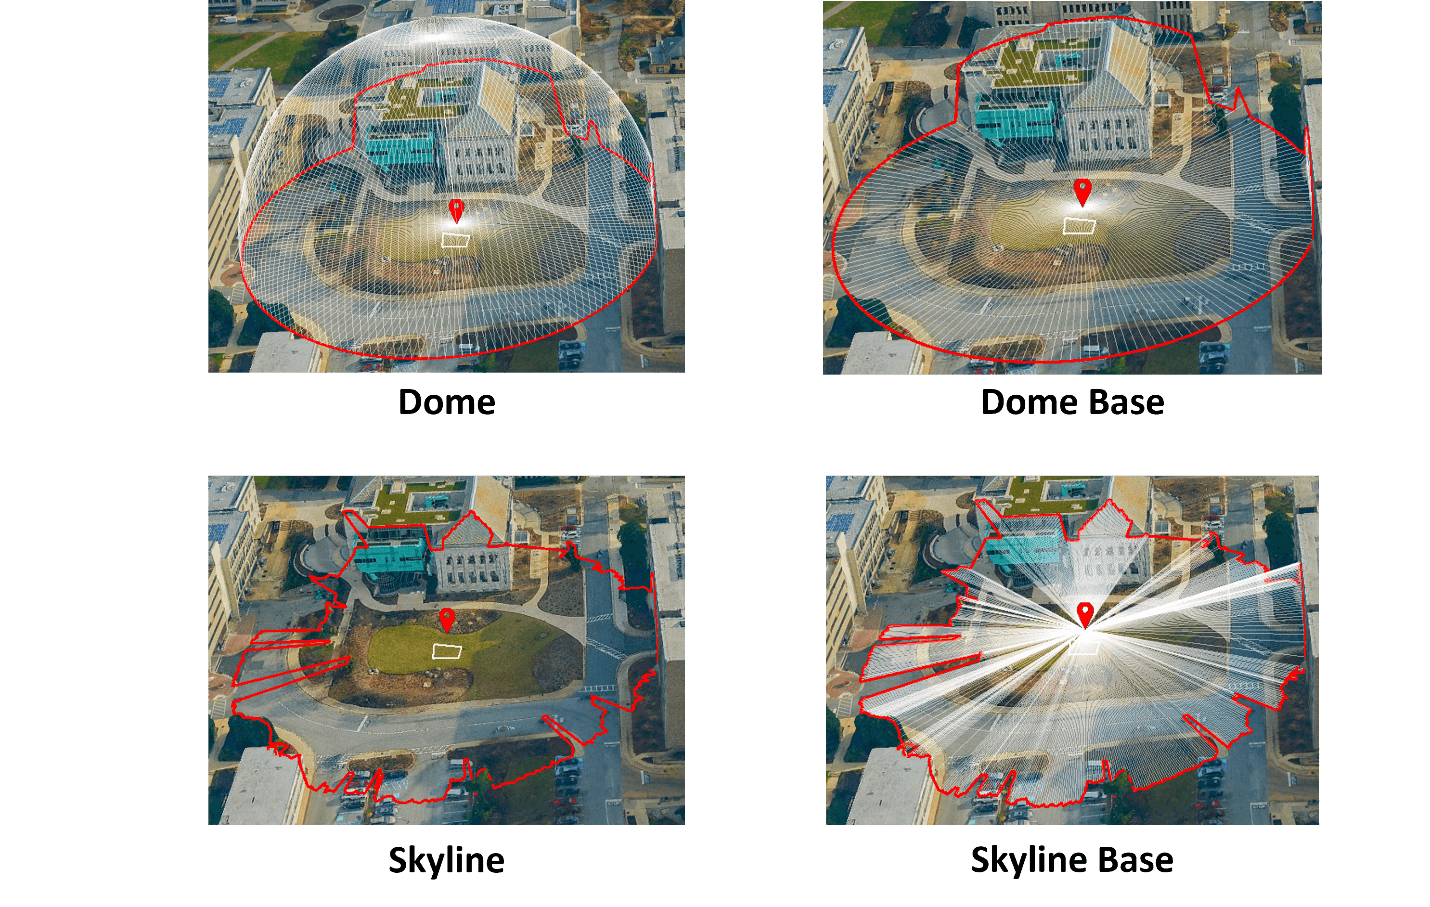
The Visibility Dome (formerly known as Threat Dome) tool analyzes and displays the area that is visible from a given point on the terrain within a 360° horizontal field of view. Several display options for the visibility dome are available so that the particular information required can be easily visualized. The visibility dome can be generated as a dome that defines the outer boundaries of the volume that is visible from the viewpoint, as a dome base that divides between . non-visible areas, or alternatively as a skyline that highlights obstructions to the field of view. After generating the visibility dome, results can be further analyzed by creating a profile graph.
Using the visibility dome tool
To use the visibility dome tool:
1. On the Analysis tab, in the Line of Sight group, click Visibility Dome. The Visibility Dome dialog is displayed.
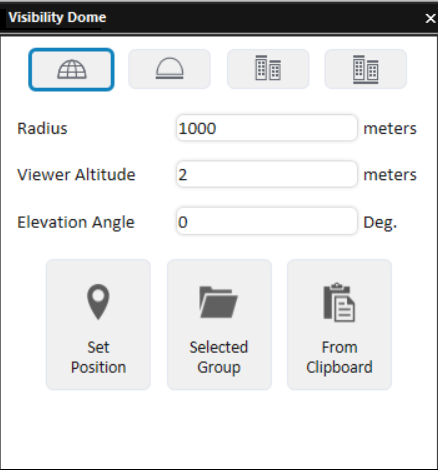
Visibility Dome
2. Set the visibility dome properties:
|
Type |
Output of the tool. Select one of the options for representing the visible area from the threat point. The visibility dome is made up of a center point representing the viewer, a ring that circumscribes the area that can be seen, and in some a dome and/or base. § Dome § Dome base § Skyline § Skyline base |
|
Quality |
Determines the distance between sample points by which the visibility dome is being calculated. High Quality will yield a more accurate result but take longer to calculate. |
|
Radius |
Radius of the visibility dome. |
|
Viewer Altitude |
Altitude above the ground for the viewer location. |
|
Elevation Angle |
Enter the angle, from the ground, below which the viewpoint cannot see. For example, an elevation angle of zero creates a complete half sphere (or base of a half sphere if Type is set to Dome base), whereas an angle of 30 degrees creates an inverted cone, topped by a section of a sphere (or just an inverted cone if Type is set to Dome base). Note: This field is not available if Type is set to Skyline. |


3. Select one of the following methods of designating the area for which the visibility dome should be calculated. If the input group contains multiple points, then individual visibility domes are generated for each of the points
§ Set Position – Click in the desired location for the visibility dome query. A marker  is created at the drawn point.
§ Selected Group - Query points are created at all point elements (point features or point objects) in the selected feature layer or group. The required Project Tree layer/group must be selected before selecting this option. A separate visibility dome is created for each of the point elements, with the center of each visibility dome indicated by a different color marker.
§ From Clipboard - Query points are created for all point elements in the clipboard. Copy the required elements to the clipboard, and click From Clipboard.
The created Visibility Dome group appears in the Visibility Dome group in the Project Tree. The created group includes a Dome polygon object, a Viewer image label representing the viewpoint, and a Ring polyline representing the perimeter of the volume that is visible from the viewpoint. You can open any of their property sheets to further control the way the visibility dome object is displayed. See "Polygon Property Sheet Parameters", "Polyline Property Sheet Parameters", and "Image Label Property Sheet Parameters" in the "Objects and Labels" chapter for more information.
4. After generating a visibility dome for a single query point, a dialog is displayed with a Show Profile button  so you can display a profile analysis of the visibility dome. To display a profile analysis, click Show Profile .
A visibility dome profile graph opens, displaying the terrain elevation profile.

Visibility Dome Profile Graph
5. Use the Zoom in  , Zoom out
  , and Zoom to full extent of data
  buttons to adjust the zoom as required.
6. Determine what information is indicated on the graph by selecting any of the following display options:
|
Waypoint |
Select the check box to mark the waypoints on the graph with a |
|
Min/Max Elevation |
Select the check box to mark the maximum and minimum points with a |
|
Min/Max Slope |
Select the check box to mark the maximum and minimum slope with a |


7. If you want to export the visibility dome profile to a shapefile layer, click Export to Layer.
Note: When a visibility dome profile is exported to a layer, the line color on the graph corresponds to the color of the points that make up the line in the layer.
8. Point to any point on the graph to display the following values. If you want to display the values and also jump to the point on the terrain, then click instead of pointing.
|
X |
X-coordinate of the selected point. |
|
Y |
Y-coordinate of the selected point. |
|
Elevation |
Elevation value of the point above the terrain database vertical datum base ellipsoid. |
|
Slope |
Slope of the curve at the selected point |
Buffer query tool
The Buffer Query tool detects all penetrations by 3D elements (e.g., 3D object or 3DML) to a set buffer zone of selected polylines. This can be used, for example, in implementing safety requirements related to safe distances from a power line. The tool scans the buffer zone of each of the polylines' query points, and colors in red all query points with breached buffer zones. Clicking this query point highlights in red the 3D elements that were found.
The output of the analysis is a point feature layer that graphically represents the locations along the line where a penetration to the buffer zone was found.
To use the Buffer Query tool:
1. On the Analysis tab, in the Line of Sight group, click Buffer Query. The Buffer Query dialog is displayed.
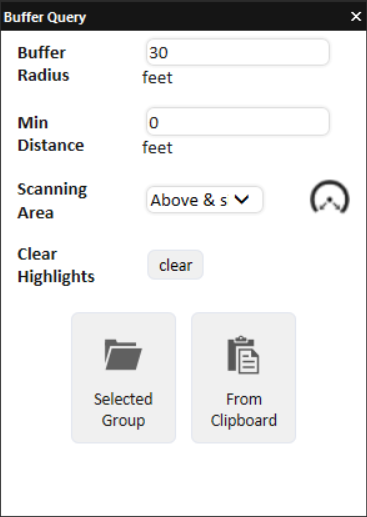
Buffer Query
2. Set the scan properties:
|
Buffer Radius |
The radial distance from each of the polyline's query points that defines the buffer zone within which 3D elements are checked for penetrations. Query points are placed along each polyline at intervals equal to half of the Buffer Radius. |
|
Min Distance |
Minimum distance from the polyline for inclusion in the buffer zone. |
|
Scanning Area |
The area to be scanned. Select Above query point (180°) to limit the scan to the FOV above the query point. Select Above & sides below (270°) to skip only the FOV directly below the query point. |
3. Select one of the following methods for selecting the polylines for the buffer query. If the input group contains multiple polylines, each one is scanned, and the results collected in a in a single result layer
§ Selected Group - Buffer scans are performed for all polylines in the selected group or layer. The required Project Tree group/layer must be selected before selecting this option.
§ From Clipboard - Buffer scans are performed for all polylines on the clipboard. The polylines must be on the clipboard before selecting this option.
4. Review the buffer query results. All query points in whose buffer zone one or more 3D elements were found are colored in red. Click a red query point to highlight in red the 3D elements that were found. Click the point again to toggle off that query point's highlighting. Click the Clear Highlights button to clear all highlighting from any query point.
5. The buffer query results are automatically exported to a point shapefile that is listed in the Project Tree and saved under the application AppData. You can find the full path to this shapefile in the layer's property sheet, in the File Name property under the Layer tab.