Terrain analysis tools
The following terrain analysis tools are available:
Contour map tools
The Contour Map tool creates a topographic map that portrays differences in terrain elevation by connecting points of equal elevation with contour lines or by coloring terrain according to varying altitudes. You can choose between the following:
§ Global Contour Map - Apply contour colors to the entire terrain and 3DML with dynamically placed contour lines that provide coarse contours when zoomed out and detailed contours when zoomed in. Elevation labels appear only on the terrain and not on the 3DML.
§ Custom Contour Map - An advanced map in which parameters such as coverage area (specified rectangular area or entire terrain), contour palette, and contour line interval can be customized, and a contour map object is added to the Project Tree. Contour colors and lines are only applied to the terrain, and not to 3DML layers.
Global contour map
To toggle on/off view of a global contour map:
§ On the Analysis tab, in the Terrain Analysis group, click Contour Map. A contour map overlays the entire 3D Window, but no contour map object is created in the Project Tree.
Note: If you want to create a contour map object for the entire terrain that will be listed in the Project Tree, create a custom contour map (See Custom Contour Map) and set the Coverage Area property in the property sheet to Entire Terrain.
Custom contour map
To create a custom contour map:
1. On the Analysis tab, in the Terrain Analysis group, click the arrow next to Contour Map, point to Custom Contour Map Object, and then click one of the following options to indicate differences in terrain elevation:
§ Contour Colors - Apply different colors from a contour palette to each elevation level.
§ Contour Lines - Connect points of equal elevation with contour lines.
§ Contour Colors and Lines - Display both contour lines and contour colors.
The Contour Map property sheet is displayed.
2. If you want to apply contour colors/lines only to terrain whose altitude is within a specific range, do the following:
a. In the Min/Max section, in the Use Min/Max field, select Yes.
b. Enter the Minimum (altitude) value and Maximum (altitude) value.
c. Select the color you want to apply to all terrain with altitude values outside of the set range.
3. In the Appearance section, in the Contour Palette field, select a contour palette from the dropdown list.
4. In the Appearance section, in the Contour Lines Color field, click Edit and select a contour line color.
5. In the Appearance section, in the Coverage Area field, select the coverage of the contour map:
§ Rectangle - A designated rectangular area.
§ Entire Terrain - The entire terrain.
6. If you set the Coverage Area field to Entire Terrain, skip to step 7.
7. If you set the Coverage Area field to Rectangle, place the cursor in the 3D Window, and click to add the first corner. Then click a second time to add the opposite corner and complete the rectangle.
8. Continue to edit the contour map’s parameters, or close the property sheet to finish the operation. See "Contour map property sheet parameters" in this chapter for information.
9. If you want to display a map legend that indicates which color represents each elevation value, right-click the contour map, and select Show Legend from the shortcut menu.
Note: After the contour map object has been created and set to display the contour lines, automatic tool tips are added to the contour lines. When the cursor is placed, in the 3D Window, above a contour line, a tool tip appears displaying the height value of the specific line. In addition, the tooltip entered in the Contour Map property sheet, is displayed when the cursor is placed over areas of colorized terrain.
Contour map property sheet parameters
|
Object Parameter |
Activity |
|
Min/Max |
|
|
Use Min/Max |
Select Yes to only display contour colors and lines for areas of the terrain whose altitude value is between the Minimum Value and Maximum Value entered below. Select No to display contour colors and lines for all altitude values as set in the contour palette. |
|
Minimum Value |
This field is only enabled when "Use Min/Max" is set to Yes. Type the minimum altitude value for which contour colors and lines should be displayed. |
|
Maximum Value |
This field is only enabled when "Use Min/Max" is set to Yes. Type the maximum altitude value for which contour colors and lines should be displayed. |
|
Color Outside of Range |
This field is only enabled when "Use Min/Max" is set to Yes. Select how you want to color all the terrain whose altitude is not within the Min/Max range: § Transparent - No color. § Red/Blue - All water is colored in blue and the rest in red. |
|
Appearance |
|
|
Name |
Type the description or name of the contour map. This text appears in the Project Tree as the name of the object. |
|
Activation Action |
Select the action to perform when selecting the object from the Project Tree. |
|
Line Opacity |
Enter the opacity for the contour and outline lines. The opacity is defined as a percentage, where 100% is opaque and 0% is transparent. |
|
Display Style |
Sets the style to display the contour map: § Select Contour lines to display contour lines at set elevation values. § Select Contour colors to represent varying altitudes in different colors according to the selected color scheme. § Select Contour Lines and contour colors to display both contour lines and contour colors. |
|
Coverage Area |
Determines the coverage of the contour map. Select Rectangle to apply to a rectangular area, or Entire Terrain to apply to the entire terrain. |
|
Contour Palette |
Sets the palette style of the contour map. Select one of the available palettes. This field is enabled only when "Display Style" is set to "Contour Colors". |
|
Fill Opacity
|
Enter the opacity for the contour map. The opacity is defined as a percentage, where 100% is opaque and 0% is transparent. This field is enabled only when "Display Style" is set to "Contour Colors". |
|
Contour Lines Color |
Select the color for the contour lines. Click the Edit button to open the Color dialog, or type the color code in hexadecimal BBGGRR format (B = Blue channel 00-ff, G = Green channel 00-ff, R = Red channel 00-ff). This option is enabled only when "Display Style" is set to "Contour Lines". |
|
Contour Lines Interval |
Determines the elevation spacing between the contour lines. The base for the contour lines is at zero elevation above the terrain database vertical datum base ellipsoid. |
|
Timespan |
|
|
Start Time |
Click Edit and select the date and time when the contour map should first become visible. |
|
End Time |
Click Edit and select the date and time when the contour map should stop being visible. |
|
Position |
|
|
X |
Enter the X-coordinate for the rectangle’s pivot point. The pivot is located at the center of the rectangle. Change this value to move the entire polyline. This field is enabled only when "Coverage Area" is set to "Rectangle". |
|
Y |
Enter the Y-coordinate for the rectangle’s pivot point. The pivot is located at the center of the rectangle. Change this value to move the entire polyline. This field is enabled only when "Coverage Area" is set to "Rectangle". |
|
MGRS |
The coordinates of the rectangle’s pivot point converted to Military Grid Reference System (MGRS) coordinates. This field is only available if Show MGRS Coordinates was selected in the Options dialog. See "View" in the "Using TerraExplorer Options" chapter for more information. |
|
Yaw |
Determines the direction angle of the contour map rectangle, along the vertical axis relative to north. Change this value to rotate the entire rectangle by a specified angle. This option is enabled only when "Coverage Area" is set to "Rectangle". |
|
Geometry |
|
|
Length |
Determines the length of the rectangle. This option is enabled only when "Coverage Area" is set to "Rectangle". |
|
Width |
Determines the width of the rectangle. This option is enabled only when "Coverage Area" is set to "Rectangle". |
|
Visibility |
|
|
Default Viewing Distance |
Determines the viewing distance of the camera from the contour map. This distance is used as a stop mark for any "Fly-to" or "View Object" operation. It is also used when selecting to edit the object from the Project Tree. When this value is set to the default of -1, TerraExplorer calculates and sets the ideal viewing distance for the contour map based on its size. |
|
Max. Visibility Distance |
Sets the distance from the camera at which the contour map disappears. |
|
Min. Visibility Distance |
Sets the minimal distance from the camera below which the contour map disappears. |
|
General |
|
|
Show In Viewer |
Determines if the contour map appears in the Project Tree when the file is viewed with TerraExplorer Viewer. |
|
Message |
The message associated with the object. The number displayed is the number of the message. To create a new message, or update an existing message, open the Create Message dialog by clicking in this field and selecting Edit. See "Using the Create Message Dialog" in the "Working with Objects" chapter for more information. |
|
Tooltip |
Type a tool tip text to appear when the mouse cursor is placed over the contour map in the 3D Window. An automatic tool tip displaying the contour line height is created for the contour lines. |
|
Order |
Set the Draw Order of the contour map. Objects with higher Order values are drawn on top of objects with lower values. |
Creating and modifying contour palettes
To create or modify a contour palette:
1. On the Analysis tab, in the Terrain Analysis group, click the arrow next to Contour Map, and then click Contour Palettes. The Elevation Color Editor dialog opens.

TerraExplorer - Elevation Color Editor
2. Do one of the following:
§ If you want to create a new contour palette, type the name of the new palette and click Add.
§ If you want to modify an existing contour palette, select the required palette.
3. If you want to add a new control handle, in the color gradient/contour box, click the location of the required new handle.
4. If you want to delete a control handle, select it and click  .
.
5. Navigate the color gradient/contour box using the five navigation buttons:
|
Button |
Description |
|
Up arrow with limit |
Jumps to the top control handle. |
|
Up arrow without limit |
Jumps to the next control handle. |
|
Left arrow |
Jumps to the currently selected control handle. |
|
Down arrow without limit |
Jumps down to the next control handle. |
|
Down arrow with limit |
Jumps to the bottom control handle. |


6. Select the required control handle. Then click the color palette and select the required color for the section.
7. If you want to clear the color gradient contour box, click Clear All.
8. If you want to restart editing from the original scheme after changes have been made, click Reload. The original scheme is loaded on the color gradient/contour box.
9. Click OK to update all the schemes updated in the current session Elevation Color Editor.
Deleting a contour palette
To delete an existing custom palette:
1. On the Analysis tab, in the Terrain Analysis group, click the arrow next to Contour Map, and then click Contour Palettes. The Elevation Color Editor dialog opens.
2. Select the required custom contour palette, and then click Delete. A warning message appears asking you to verify the Delete command.
3. Click Yes to verify or No to cancel.
Slope map tools
The Slope Map tools provide slope information for a specified area or the entire terrain. You can choose between the following:
§ Global Slope Map - Applies default palette colors and direction arrows to entire terrain according to slope degree and aspect. Slope map colors are rendered on terrain textures as well as on 3DML layers.
§ Custom Slope Map - An advanced slope map in which parameters such as coverage area (specified rectangular area or entire terrain), slope palette, and arrow color can be customized, and a slope map object is added to the Project Tree. The custom slope map can show degree and/or aspect (direction). Slope colors and arrows are only applied to the terrain, and not to 3DML layers.
§ Slope Map Query – Graphically represents slope values in a specified area using a color-coded point shapefile that is added to the Project Tree.
§ Slope Cursor - Displays slope information in a specified radius around a selected point.
§ Slope Palette - Opens the Elevation Color Editor to allow creation of new slope palettes or modification of existing ones.
Global slope map
To toggle on/off view of a global slope map:
§ On the Analysis tab, in the Terrain Analysis group, click Slope Map. A slope map overlays the entire 3D Window, but no slope map object is created in the Project Tree.
Note: If you want to create a slope map object for the entire terrain that will be listed in the Project Tree, create a custom slope map (See Custom Slope Map) and set the Coverage Area property in the property sheet to Entire Terrain.
Custom slope map
To create a custom slope map:
1. On the Analysis tab, in the Terrain Analysis group, click the arrow next to Slope Map, point to Custom Slope Map Object, and then click one of the following options:
§ Slope Color Map - Apply palette colors to the terrain according to degree of slope.
§ Slope Directions - Display on terrain arrows indicating the direction of the slope.
§ Slope Color Map with Directions - Display both slope colors and arrows indicating slope direction.
The Slope Map property sheet is displayed.
2. In the Slope Analysis property sheet, in the Appearance section, in the Coverage Area field, select the coverage of the contour map:
§ Rectangle - A designated rectangular area.
§ Entire Terrain - The entire terrain.
3. If you set the Coverage Area field to Entire Terrain, skip to step 5.
4. If you set the Coverage Area field to Rectangle, place the cursor in the 3D Window, and click to add the first corner. Then click a second time to add the opposite corner and complete the rectangle.
5. Edit the slope map’s parameters, or close the property sheet to finish the operation.
6. If you want to display the map’s legend indicating which color represents each slope range, right-click the slope map, and select Show Legend from the shortcut menu.
Note: After the slope map object has been created and set to display the contour lines, automatic tool tips are added to the slope lines. When the cursor is placed, in the 3D Window, above a slope line, a tool tip appears displaying the slope of the specific line. In addition, the tooltip entered in the Slope Analysis property sheet is displayed when the cursor is placed over areas of colorized terrain.
Slope analysis property sheet parameters
|
Object Parameter |
Activity |
|
Appearance |
|
|
Name |
Type the description or name of the slope map. This text appears in the Project Tree as the name of the object. |
|
Activation Action |
Select the action to perform when selecting the object from the Project Tree. |
|
Display Style |
Sets the style to display the slope map: § Select Slope arrows to display arrows indicating where the slope increases and where it decreases. § Select Slope colors to apply a color palette based on the steepness of the slope. § Select Slope arrows and colors to display both slope colors and directions. |
|
Coverage Area |
Determines the coverage of the object. Select Rectangle to apply to a rectangular area, or Entire Terrain to apply to the entire terrain. |
|
Slope Palette |
Sets the palette style of the slope map. Select one of the available palettes. This option is enabled only when "Display Style" is set to Slope color map or Slope directions and color map. |
|
Fill Opacity |
Enter the opacity for the slope map. The opacity is defined as a percentage, where 100% is opaque and 0% is transparent. |
|
Arrow Color |
Select the fill color for the arrows. This option is enabled only when "Display Style" is set to Slope directions or Slope directions and color map. Click the Edit button to open the Color dialog, or type the color code in hexadecimal BBGGRR format (B = Blue channel 00-ff, G = Green channel 00-ff, R = Red channel 00-ff). |
|
Timespan |
|
|
Start Time |
Click Edit and select the date and time when the map should first become visible. |
|
End Time |
Click Edit and select the date and time when the map should stop being visible. |
|
Position |
|
|
X |
Enter the X-coordinate for the rectangle’s pivot point. The pivot is located at the center of the rectangle. Change this value to move the entire polyline. This field is enabled only when "Coverage Area" is set to Rectangle. |
|
Y |
Enter the Y-coordinate for the rectangle’s pivot point. The pivot is located at the center of the rectangle. Change this value to move the entire polyline. This field is enabled only when "Coverage Area" is set to Rectangle. |
|
MGRS |
The coordinates of the rectangle’s pivot point in Military Grid Reference System (MGRS) coordinates. This field is only available if Show MGRS Coordinates was selected in the Options dialog. See "View" in the "Using TerraExplorer Options" chapter for more information. |
|
Yaw |
Determines the direction of the slope map rectangle, along the vertical axis relative to north. Change this value to rotate the entire rectangle by a specified angle. This field is enabled only when "Coverage Area" is set to Rectangle. |
|
Geometry |
|
|
Length |
Determines the length of the rectangle. This field is enabled only when "Coverage Area" is set to Rectangle. |
|
Width |
Determines the width of the rectangle. This field is enabled only when "Coverage Area" is set to Rectangle. |
|
Visibility |
|
|
Default Viewing Distance |
Determines the viewing distance of the camera from the slope map. This distance is used as a stop mark for any "Fly-to" or "View Object" operation. It is also used when editing the object from the Project Tree. When this value is set to the default of -1, TerraExplorer calculates and sets the ideal viewing distance for the map based on its size. |
|
Max. Visibility Distance |
Sets the maximal distance from the camera above which the slope map disappears. |
|
Min. Visibility Distance |
Sets the minimal distance from the camera below which the slope map disappears. |
|
General |
|
|
Show in Viewer |
Determines if the slope map appears in the Project Tree when the file is viewed with TerraExplorer Viewer. |
|
Message |
The message associated with the object. The number displayed is the number of the message. To create a new message, or update an existing message, open the Create Message dialog by clicking in this field and selecting Edit. See "Using the Create Message Dialog" in the "Working with Objects" chapter for more information. |
|
Tooltip |
Type a tooltip text to appear when the mouse cursor is placed over the slope map colorized terrain area in the 3D Window. |
|
Order |
Set the Draw Order of the slope map. Objects with higher Order values are drawn on top of objects with lower values. |
Creating and modifying slope palettes
Custom slope palettes can be created using the Elevation Color Editor.
To create or modify a contour palette:
1. On the Analysis tab, in the Terrain Analysis group, click the arrow next to Slope Map, and then click Slope Palettes. The Elevation Color Editor dialog opens.

TerraExplorer - Elevation Color Editor
2. Do one of the following:
§ If you want to create a new slope palette, type the name of the new palette and click Add.
§ If you want to modify an existing contour palette, select the required palette.
3. If you want to add a new control handle, in the color gradient/contour box, click the location of the required new handle.
4. If you want to delete a control handle, select it and click .
5. Navigate the color gradient/contour box using the five navigation buttons:
|
Button |
Description |
|
Up arrow with limit |
Jumps to the top control handle. |
|
Up arrow without limit |
Jumps to the next control handle. |
|
Left arrow |
Jumps to the currently selected control handle. |
|
Down arrow without limit |
Jumps down to the next control handle. |
|
Down arrow with limit |
Jumps to the bottom control handle. |
6. Select the required control handle. Then click the color palette and select the required color for the section.
7. If you want to clear the color gradient contour box, click Clear All.
8. If you want to restart editing from the original scheme after changes have been made, click Reload. The original scheme is loaded on the color gradient/contour box.
9. Click OK to update all the schemes updated in the current session Elevation Color Editor.
Deleting a slope palette
To delete an existing custom palette:
1. On the Analysis tab, in the Terrain Analysis group, click the arrow next to Slope Map, and then click Slope Palettes. The Elevation Color Editor dialog opens.
2. Select the required custom slope palette, and then click Delete. A warning message appears asking you to verify the Delete command.
3. Click Yes to verify or No to cancel.
Slope map query
The Slope Map query tool calculates the slope value in a specified area. The area is defined by a drawn line or polygon, or by a selection of lines or polygons.
The output of the analysis is a point shapefile that graphically represents the slope values at different points in the specified area. Each point in the feature layer is color-coded according to the elevation model steepness:
§ Sky blue = Slope value is lower than 6 degrees
§ Blue = Slope value is between 6 - 17 degrees
§ Green = Slope value is between 17 - 31 degrees
§ Yellow = Slope value is between 31 - 38 degrees
§ Orange = Slope value is between 38 - 45 degrees
§ Red = Slope value is greater than 45 degrees
To use the Slope Map Query tool:
1. On the Analysis tab, in the Terrain Analysis group, click the arrow next to Slope Map, and then click Slope Map Query. The Slope Map Query dialog opens.
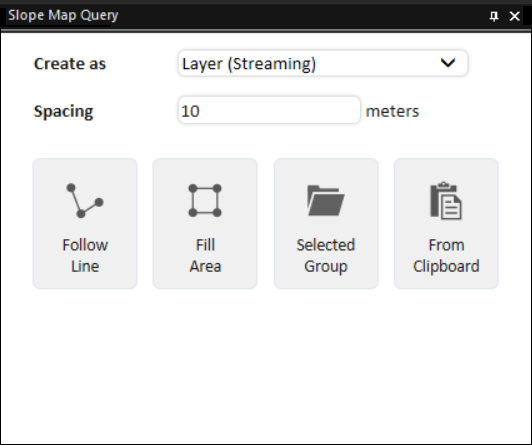
Slope Map Query Tool
2. Select one of the Create as options:
§ Layer (Entire) - Create a feature layer under the application's AppData.
§ Layer (Streaming) - Create a streaming feature layer under the application's AppData.
3. In the Spacing field, type the horizontal and vertical spacing (in meters) between query points in the area for which the slope is being calculated.
4. Select one of the following methods of designating the area for which the slope map query should be calculated:
§ Follow Line - Query points are created along the drawn line. In the 3D Window, left-click to place the line waypoints, and right-click to complete the line.
§ Fill Area - Query points are created inside the drawn polygon. In the 3D Window, left-click to place the polygon waypoints, and right-click to complete the polygon.
§ Selected Group - Query points are placed along each polyline and inside each polygon, in the selected feature layer or group. The required Project Tree layer/group must be selected before selecting this option.
§ From Clipboard - Query points are placed along each polyline and inside each polygon clipboard object.
5. Slope map queries are performed for each polyline/polygon and results are automatically exported to point shapefiles that are listed in the Project Tree and saved under the application AppData. You can find the full path to each shapefile in the layer's property sheet, in the File Name property under the Layer tab.
Slope cursor
The Slope Cursor tool displays slope information in a specified radius around a selected point.
To use the Slope Cursor tool:
1. On the Analysis tab, in the Terrain Analysis group, click the arrow next to Slope Map, and then click Slope Cursor. The Slope Cursor dialog opens.

Slope Cursor Dialog
2. Set the Slope Cursor properties
|
Property |
Description |
|
Display Max Slope Values |
Defines whether the maximum positive and maximum negative slope values are displayed. Choose between Never, On Click and Always. |
|
Display Heading Slope |
Defines whether the heading slope value is displayed. Choose between Never, On Click and Always. The heading is the current direction of the camera. |
|
Display Coordinate Info |
Defines whether the selected coordinate information is displayed. Choose between Never, On Click and Always. |
|
Measure Distance |
Defines the measurement radius around the center point. |
|
Alert Slope |
Apply colors to slope based on Alert rating levels. |
|
Danger Slope |
Apply colors to slope based on Danger rating levels. |
3. Click Start Cursor to start the slope query.
4. Point to the terrain to view slope arrows showing the maximum positive and maximum negative slope angles for the selected point.
5. Click to recalculate slope values using a more precise method. The calculation may take a few seconds.
6. Right-click or click Stop to exit Slope Cursor mode.
Best path tool
The Best Path tool calculates the best path between two locations on the terrain without exceeding defined slope constraints. It enables realistic path planning by modeling movement limitations such as maximum climb, descent, and side slopes, as well as minimum path width.
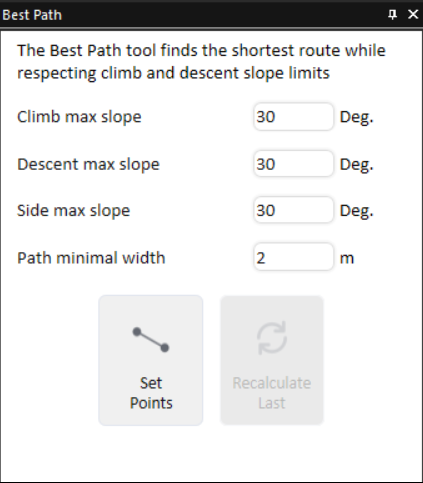
Best Path Tool
To calculate a best path:
1. On the Analysis tab, in the Terrain Analysis group, click Best Path. The Best Path tool is displayed.
2. Set the required Best Path parameters:
§ Climb max slope – Maximum allowable upward slope (in degrees) for the calculated path.
§ Descent max slope – Maximum allowable downward slope (in degrees) for the calculated path.
§ Side max slope – Maximum side slope (in degrees) tolerated along the path. This property is used to ensure stability, especially in scenarios where side tilting is a concern (e.g., for vehicles or equipment).
§ Path minimal width – Minimum required width (in meters/feet) for the path.
3. Click Set Points. Then in the 3D Window, click to define the start point for the path and click again to define the endpoint. Once the Best Path has been calculated, it is displayed in the 3D Window. Two objects are created and added to the Project Tree:
§ Best Path Line - Representing the points you drew
§ Best Path Result - Representing the calculated best path between those points.
4. If you want to edit the best path's parameters and recalculate it, make the required modifications in the Best Path dialog and then click Recalculate. Each newly calculated path is displayed in a different color in the 3D Window for easy comparison.
5. Click Close to close the tool.
Clear path tool
The Clear Path tool identifies suitable locations for specific purposes, such as helicopter landing zones or vehicle pathways within a specified search radius.
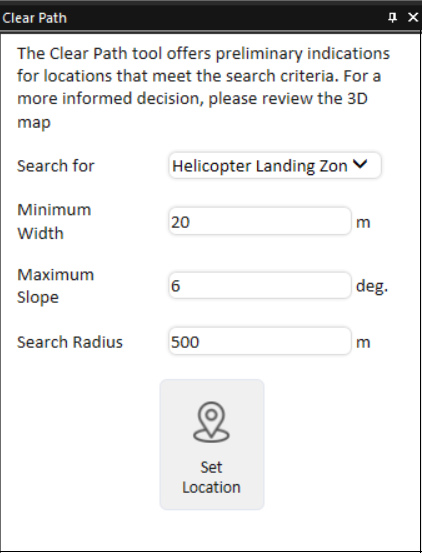
Clear Path Tool
To calculate a clear path:
1. On the Analysis tab, in the Terrain Analysis group, click the arrow under Best Path, and select Clear Path. The Clear Path tool is displayed.
2. In the Search For field, select a predefined location (e.g., helicopter landing zone). The minimum width and maximum slope are automatically set to those suitable for your selected location type. If you want to set your own minimum width and maximum slope parameters, select Custom.
3. In the Search Radius, set the radius within which you want the tool to search for appropriate locations .
4. Click Set Location, and then click in the 3D Window to define the center of your search area. When the analysis is complete, the area that meets your search criteria is highlighted in green in the 3D Window.
5. Click Close to close the tool.
High and low tool
The High and Low tool identifies areas of highest and lowest elevation in a selected area of interest.

High and Low Tool
To highlight high and low areas:
1. On the Analysis tab, in the Terrain Analysis group, click the arrow under Best Path, and select High and Low. The High and Low tool is displayed.
2. In the Highlight Mode field, select the area(s) you want to highlight.
3. Set the Top and Bottom Percentages.
4. In the Search Radius, set the radius within which the terrain will be analyzed.
5. Click Set Location, and then click in the 3D Window to define the center of your search area. When the analysis is complete, the highest areas are colored in green and the lowest areas in red in the 3D Window.
Elevation profile tool
The Elevation profile tool shows how elevation varies along a defined path, including details such as maximum and minimum elevation values and slope. It can also compare, on the same graph, profiles of two different layers or of a layer and the base terrain.
To use the Elevation profile tool:
1. On the Analysis tab, in the Terrain Analysis group, click Elevation profile. The Elevation profile dialog is displayed.

Elevation profile – Compare Mode
2. Enter the following parameters:
|
Mode |
Select the profile mode: § Normal – Display a profile only for the selected polyline(s). § Compare – Generate two elevation profiles on the same graph, one for each selected layer or for a layer and the base terrain, to make it easy to visualize differences in elevation between them. |
|
Quality |
Determines the distance between sample points along the polyline for which the elevation profile is being calculated. High Quality will yield a more accurate result but take longer to calculate. |
|
Filters |
(Compare mode only) Toggle on the layer types (3D mesh, point cloud, elevation, feature) which you want to include in the layer dropdown lists. |
|
Layer #1/Layer #2 |
(Compare mode only) Select the two layers (Layer #1 and Layer #2) for comparison. Only layers that are calculated as part of the terrain’s elevation (i.e., their “Ground Object” property is set to yes) are included in the dropdown lists. If you want to refresh the dropdown layers, and automatically detect and select the layers in current view, click Refresh List. |
|
Layer #2 |
This field is only displayed in Compare mode. |
3. Select one of the following methods of designating the polyline(s) for which the elevation profile should be calculated:
§ Draw Line – An elevation profile is created along the drawn line. In the 3D Window, left-click to place the line waypoints, and right-click to complete the line.
§ Selected Group – An elevation profile is created for each of the polylines in the selected group. Select the required layer from the Project Tree, and then click Selected Group. This option is only available in Normal mode.
§ From Clipboard – An elevation profile is created for each of the polylines on the clipboard.
An elevation profile graph opens. In Compare mode, both layers are displayed on the same graph.

Elevation Profile Graph
4. Use the Zoom in  , Zoom out
  , and Zoom to full extent of data
  buttons to adjust the zoom as required.
5. Determine what information is indicated on the graph by selecting any of the following display options:
|
Waypoint |
Select the check box to mark each of the polylines' waypoints on the graph with a |
|
Min/Max Elevation |
Select the check box to mark each of the polylines' maximum and minimum points with a |
|
Min/Max Slope |
Select the check box to mark each of the polylines' maximum and minimum slope with a |


6. If you want to export the elevation profile to a shapefile layer, click Export to Layer.
Note: When an elevation profile created for multiple lines (in a group or from clipboard), is exported to a layer, the line color on the graph corresponds to the color of the points that make up the line in the layer.
7. Point to any point on the graph to display the following values. If you want to display the values and jump to the point on the terrain, then click instead of pointing.
|
Value |
Description |
|
X |
X-coordinate of the selected point. |
|
Y |
Y-coordinate of the selected point. |
|
Elevation |
Elevation value of the point above the terrain database vertical datum base ellipsoid. |
|
Slope |
Slope of the curve at the selected point |
Note: In Compare mode, all layers except the two selected ones are temporarily hidden to prevent interference with the calculations. After the calculations are performed, the original visibility for all the layers is restored.
Flood tool
The Flood tool analyzes land areas impacted by water under different flooding scenarios and generates polygons representing flooded regions. It supports both 2.5D terrain projects (imagery + DTM/DSM elevation) and 3D mesh and Gaussian Splatting models, including advanced 3D behavior such as identifying areas where water can flow beneath bridges.
Analysis starts from either a single source location or from multiple source points distributed along a drawn polyline. The following flood scenarios are supported:
§ Single Instance - Water level rises once.
§ Continuous Rise - Water level rises at a constant rate over a certain period of time.
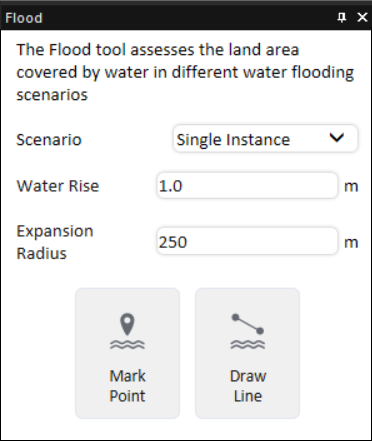
To use the Flood tool:
1. On the Analysis tab, in the Terrain Analysis group, click Flood.
2. In the property sheet, set the following properties:
§ Scenario – Select either:
§ Single Instance - Water level rises once.
§ Continuous Rise - Water level rising at a constant rate over a certain period of time.
§ Expansion Radius - The radius within which the tool checks the surrounding terrain for possible flood spread from each origin point or along each line segment.
3. If you selected Single Instance in the Scenario field, enter the Water Rise - flood water elevation.
4. If you selected Continuous Rise in the Scenario field, set the following parameters:
§ Hourly Water Rise – Amount that the water level increases per hour.
§ Duration – Number of hours during which the water level rises.
5. Define the flood source using either of the following methods:
§ Mark Point: Sets a fixed geographical point, such as a breach in a dam or a water main break. In the 3D Window, click any point on the terrain or model to mark the center of the circular area to be analyzed.
§ Draw Line: Sets a linear flood source, such as a riverbank overflowing its boundaries. In the 3D Window, click any point on the terrain or model to define the start point of the flood source, and click again to set the end point. The base elevation is derived from the line's first waypoint.
The resulting flooded regions are displayed as semi-transparent blue polygons, positioned at absolute altitude. An outline polygon representing the combined flood extent is also generated. In Continuous Rise mode, flood polygons are grouped by time step, with a separate subfolder folder created for each hour of the water rise. The time-step folders are organized as a radio group in the Project Tree, enabling you to switch between the different flood stages.
Volume tool
The Volume Analysis tool analyzes the volume of the terrain or model removed or added by selected horizontal planes or modify terrain/3DML objects.
To use the Volume Analysis tool:
1. On the Analysis tab, in the Terrain Analysis group, click Volume. The Volume dialog is displayed.
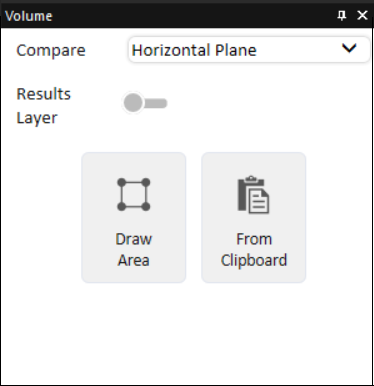
Volume Analysis Tool
2. In the Compare field, select one of the following analysis modes:
§ Horizontal Plane – Calculate the volume added or removed by a horizontal plane defined either by a polygon you now draw or by polygons already on the clipboard.
§ Modify Terrain – Draw New – Calculate the volume added or removed by a new Modify Terrain object that you now create.
§ Modify Terrain – Select Existing – Calculate the volume added or removed by the Modify Terrain object(s) selected from the list.
3. Enter the required parameters:
|
Parameter |
Description |
|
Select |
This field is displayed only when Modify Terrain – Select Existing mode is selected. Select one or more Modify Terrain objects from the list. Use CTRL-click or SHIFT-click to multi-select. Click Refresh list to update the list if changes were made to the project. |
|
Results Layer |
Toggle the switch on to create a point shapefile representing each volume analysis result. The area and volume (removed or added) of each sample in the feature layer is stored in the Volume Area and Volume Difference attribute fields of the feature that represents the sample. |
4. Perform the steps relevant to the selected mode:
Horizontal Plane
a. Select either of the following methods to mark your area of interest:
§ Draw Area – The area is marked by drawing a polygon in the 3D Window. If this option is selected, left-click in the 3D Window to place the polygon waypoints, and right-click to complete.
§ From Clipboard – Analysis is performed in the locations of all polygon clipboard objects. The polygons must be on the clipboard before selecting this option.
b. Click Calculate.
Modify Terrain – Draw New
a. Click Create Modify. The Modify Terrain property sheet is displayed.
b. In the 3D Window, left-click to place the polygon waypoints, and right-click to complete.
c. Close the property sheet to start calculation.
Modify Terrain – Select Existing
a. In the Select field, select one of the project’s modify terrain objects.
b. Click Start Calculation.
5. When calculation is complete, a dialog is displayed with the analysis results.
Cross section tool
The Cross Section tool makes a horizontal or vertical straight cut to expose obscured sections of the 3D View. The cross section slider increments are based on the Plane Size set and the distance between the camera and the plane when creating the cross section box, i.e., the narrower the plane and the closer the camera, the smaller the increments.
To use the Cross Section tool:
1. On the Analysis tab, in the Terrain Analysis group, click Cross Section. The Cross Section dialog is displayed.

Cross Section Tool
2. Select a mode.
§ Auto – The direction of the cross section automatically adjusts based on the surface under the cursor. If the cursor points at a vertical surface, such as the side of a building, a vertical cross section is created. Conversely, when the cursor is over the terrain or any horizontal flat surface, like rooftops, a horizontal cross section is generated.
§ Horizontal – Create horizontal cross sections.
§ Vertical – Create vertical cross sections.
3. Click Start.
4. In the 3D Window, click where you want to create a cross section.
5. Adjust the cross-section plane using the sliders:
§ Move  – Repositions the cross-section plane. When cutting a horizontal cross section, slide the slider to the right to lower the plane (increasing the section being clipped), and left to raise it. When cutting a vertical cross section, slide the slider to the left to move the cross-section plane forward, and right to move it backward.
§ Size  – Changes the size of the plane. Slide right to increase size, left to decrease.
§ Rotate  – Rotates the plane (0–360°).
Clip box tool
The Clip Box tool clips everything except labels that are outside or inside of a selected box to help you focus on specific elements in your 3D project.
To use the Clip Box tool:
1. Draw a box around the area, e.g., building, you want to clip. See "Creating a 3D Shape – Box" in the "Objects and Labels" chapter for information.
2. In the Project Tree, select the box you want to use for the clipping operation.
3. On the Analysis tab, in the Terrain Analysis group, click Cross Section and select Clip Box. The Clip Box controls are displayed. If no box was selected in the Project Tree, a dialog is displayed asking if you want to draw a box. Click OK to draw a box. Then close the box's property sheet to start the clip box analysis.
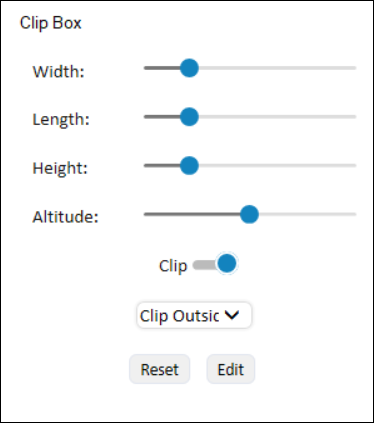
Clip Box Tool
4. Use the Clip Box controls to change the dimensions of the box, and to determine the clip area: inside or outside the box:
|
Parameter |
Description |
|
Width |
Determines the width of the box. Slide the slider to the right to increase the width and left to decrease (5-500% of starting width). |
|
Length |
Determines the length of the box. Slide the slider to the right to increase the length and left to decrease (5-500% of starting length). |
|
Height |
Determines the height of the box. Slide the slider to the right to increase the height and left to decrease (5-500% of starting height). |
|
Altitude |
Determines the altitude of the box. Slide the slider to the right to move it up and left to move it down (range of +/- 500 meters from the starting altitude). |
|
Clip outside/ Clip inside |
Defines the area to be clipped. |
5. Click Reset if you want to restore the original dimensions of the box.
6. Toggle the clipping action using the Clip switch.
7. Click Edit to close the Clip Box tool, and edit the box in the 3D Window using the object's resizers and rotators. See "Editing a 2D or 3D Object Using Object Handles" in the "Working with Objects" chapter for information.
8. Close the Clip Box controls to return to the normal view mode.