
Which parts of a complex site are visible from a proposed observation point? Where does a structure interrupt that view? How much could the answer change if the model is missing a wall or uses outdated building heights?
These are the questions 3D geospatial intelligence helps teams answer. Its value becomes clear when height, structure, and spatial relationships affect a decision. The analyst needs to examine the geometry, trace it to its sources, and explain what the evidence supports. The final product should carry that explanation to the person using it, including the limits that could change the answer.
Key Takeaways
- 3D geospatial intelligence applies GEOINT methods to questions involving three-dimensional terrain, structures, and activity.
- Useful findings depend on suitable data, understood accuracy, collection dates, and coverage. Visual realism alone cannot establish those qualities.
- A sound workflow connects the question to sources, analysis, corroboration, a qualified finding, and a decision.
- Geospatial intelligence software should make the evidence and assumptions inspectable, with a practical way to deliver findings to other users.
What Is 3D Geospatial Intelligence?
3D geospatial intelligence is the analysis of geographically referenced information using three-dimensional representations of the physical world. It helps analysts assess relationships such as visibility, relative height, clearance, and changes in structures or terrain.
It sits within the broader GEOINT discipline, which the National Geospatial-Intelligence Agency describes as using imagery and geospatial information to understand features, activities, and locations. The analytical standards remain the same: establish the question, evaluate the sources, and distinguish evidence from interpretation.
Traditional GIS already calculates viewsheds and volumes from elevation data, including in workflows that display results on 2D maps. A 3D environment makes vertical relationships easier to inspect and, where the data and tools support it, allows more detailed analysis of structures, facades, and overhangs.
The geometry still has limits. Photogrammetry estimates shape and position from overlapping images; LiDAR measurements also carry uncertainty. A textured mesh, point cloud, and elevation grid are different representations, with different strengths. None guarantees accuracy by its format or appearance.
Teams can move between 2D and 3D as the question requires. A regional overview may be clearest on a map. Understanding why a building blocks a view may benefit from inspecting the scene in 3D.
The Data Layers Behind 3D Geospatial Intelligence
The question determines which layers belong in the project. A visibility assessment may need terrain, structures, and vegetation. A change assessment also needs comparable observations from different dates.
Imagery provides the visual record. Satellite, aerial, and drone images help analysts interpret a site, and overlapping images can support photogrammetric reconstruction. Shadows, viewing angles, and obscured surfaces affect what can be recovered.
Elevation models describe surface heights. A digital terrain model represents bare earth; a digital surface model generally includes buildings and vegetation. Choosing bare terrain for a question about obstruction by buildings would omit essential evidence.
Meshes and point clouds describe geometry in greater detail. Meshes represent surfaces, often with image textures. Point clouds contain sampled positions from LiDAR or photogrammetry. Check whether important edges and narrow structures are represented, and whether gaps were filled during processing.
Feature layers add meaning through attributes: building use, road classification, boundaries, or an analyst’s annotations. Their labels and update dates need scrutiny too.
Time-based information adds activity, such as sensor observations or asset locations. A live feed can provide current context while the underlying geometry remains months old. Refreshing that geometry requires new collection or another validated update.
Before analysis, layers must align in a shared spatial reference, including compatible vertical references and units. They can originate in different coordinate systems and be transformed. Analysts should check the transformation and local alignment, particularly where datasets overlap.
Collection dates, resolution, coverage, processing history, and available accuracy assessments should remain attached to the data. A model may be suitable across most of a site yet unreliable at the one roof edge that determines the answer.
What 3D Geospatial Technology Needs to Deliver
The practical test for 3D geospatial technology is whether another analyst can understand how a finding was produced and judge whether it is useful for the decision. That requires access to sources, clear analysis settings, and a way to retain uncertainty with the result.
A visibility assessment from question to finding
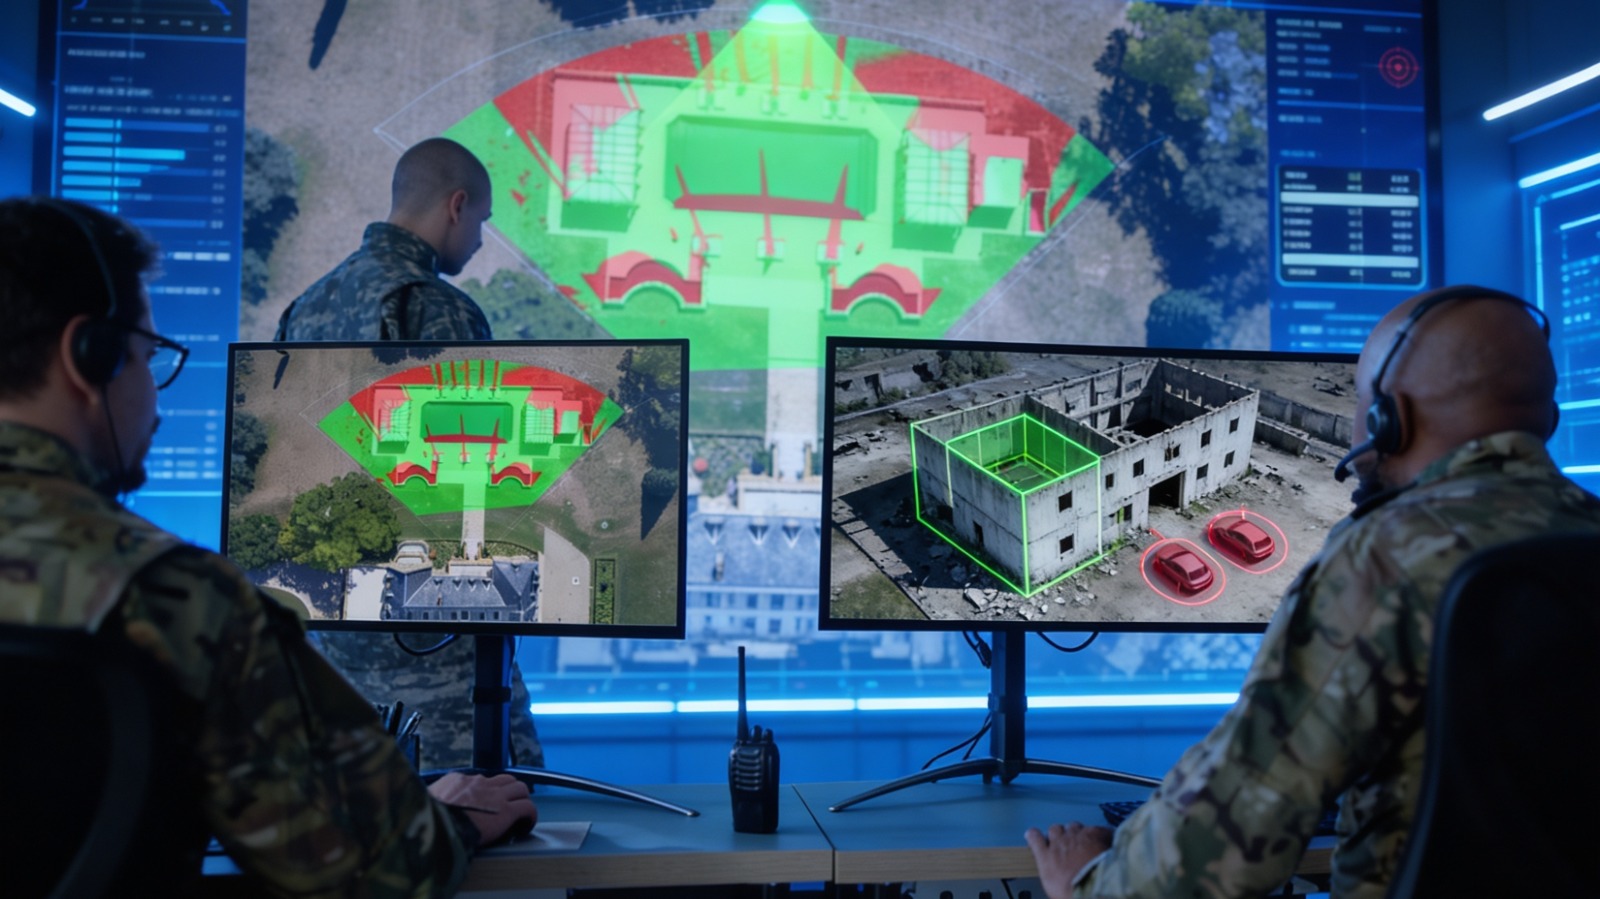
Consider a facilities team assessing visibility of a pedestrian courtyard from a proposed staffed observation point at a large campus. Buildings, a covered walkway, and trees complicate the view. This illustrative assessment follows six steps.
- Define the question. Specify the area being assessed, the observation height, and what “visible” means for the task. Seeing part of the courtyard does not establish that every entrance is visible.
- Select and check sources. Assemble the terrain and structural data, relevant imagery, and site features. Check collection dates, coverage, alignment, and whether vegetation and the covered walkway are represented adequately.
- Run the analysis. Calculate the viewshed using the relevant surfaces and inspect the blocked areas in 3D. Record the observation position, height, and analysis settings. Test plausible changes in uncertain heights to see whether the conclusion is sensitive to them.
- Corroborate the result. Inspect source images around the obstructions and seek independent evidence where it matters, such as a separate recent collection or a site check. Reviewing the photographs used to build the model can reveal interpretation or reconstruction problems, but does not independently establish positional accuracy.
- State a qualified finding. A finding might read: “The model indicates that the covered walkway blocks part of the courtyard from the proposed point. Visibility near the tree line remains uncertain because foliage has changed since collection.” Keep unresolved areas distinct from areas assessed as blocked.
- Use and retain the finding. The facilities team can prioritize a site inspection or revise the proposal. Deliver the annotated view with dates, assumptions, and open checks so the next user understands when the assessment needs revisiting.
The analysis now supports a specific decision, and the next person can inspect the reasoning. A screenshot without those details would leave them to guess what was tested.
Tools that support the workflow
Skyline’s products illustrate several parts of this process. PhotoMesh reconstructs 3D models from imagery. TerraExplorer brings geospatial layers together and provides line-of-sight, viewshed, and comparison tools. Its Photo Inspector lets analysts examine a PhotoMesh model alongside the photographs used to produce it. This gives them a practical route back to the image evidence.
The analyst still has to establish fitness for use. That includes independent checks where required, an understanding of errors introduced during collection and processing, and an explanation of uncertainty at the features that matter. More detailed textures cannot resolve missing evidence.
Delivery is part of the same workflow. SkylineGlobe Server publishes and streams geospatial layers for shared access. Disconnected work requires a prepared local dataset, the appropriate software edition, and hardware suited to the project. Teams should test the actual package before relying on it away from the network.
For defense and intelligence organizations, these requirements also apply to site assessment, planning, and reviewing change. Skyline’s defense and intelligence solutions provide that broader context. Across applications, a useful intelligence product leaves the user able to answer two questions: What does the evidence support, and what could change that conclusion?
FAQ
Is 3D geospatial intelligence the same thing as GEOINT?
GEOINT is the broader discipline of interpreting imagery and geospatial information. 3D geospatial intelligence applies that discipline to three-dimensional representations, especially when height, structure, and spatial relationships affect the question. It uses the same source evaluation and analytical judgment, alongside appropriate geometry and analysis tools.
How current does 3D geospatial data need to be to support operational decisions?
Freshness depends on what could change the answer. Stable terrain may remain useful longer than vegetation, construction, or moving activity. Check each layer’s collection date against relevant changes, document what is unknown, and seek updated evidence when those changes could materially affect the decision. A live overlay does not update the underlying model.
Does 3D geospatial intelligence require a server, or can it run on a field laptop?
Both are possible. Servers support shared datasets, while a field laptop can use a prepared offline project. TerraExplorer supports offline workflows, with capabilities varying by edition. Dataset size, graphics hardware, storage, and access to required resources affect performance, so validate the intended configuration and package before deployment.
Who inside an organization typically produces 3D geospatial intelligence?
Geospatial and imagery analysts usually develop the findings, supported by survey, data production, or engineering teams that prepare and validate the inputs. The people using the results help define the question and required confidence. Responsibility for interpreting evidence and communicating uncertainty remains with the analyst, even when processing is automated.